The short days and long nights in late fall provide a skewing of cooling/freezing hours. When temperatures fall below freezing at sunset and stay freezing after sunrise for several days during late fall-winter solstice times, ice formation becomes more favorable. Since temperature can spike during the day, temperatures typically need to fall well below freezing to insure adequate cooling to overcome heat flux form absorbed solar heat and latent heat exchange. Otherwise, thawing occurs. Optimum conditions often occur on new water ice that sheets clean rapidly in very cold calm conditions. Rapid cooling can produce ice with fewer air bubbles making the ice clear and transparent. Once ice has formed, latent heat of fusion works to the advantage of maintaining state through short warming periods allowing water ice to form in subsequent cold snaps; however, it is the new ice that is often the best and also the thinnest. Ice for ice skating is often good early season before snow has had a chance to cover the ice and ruin the ice. Ice that has under gone excessive freeze-thaw, strong winds or accumulated debris can ruin the quality also. Old ice tends to crack and form ridges which ruins quality. Early season/late fall ice is often best; often this ice is on the thin side which requires careful monitoring of conditions during formation.
Ice Formation Index
| For lack of a better term, I am using this term to describe the integrated temperature conditions over time that favor ice formation for ice skating. The index utilizes the a concept of integrated temperature accumulation above or below a reference value to indicate an accumulative effect. Although one could use an average, that can be misleading, since spiked low minimum temperatures can skew the average. In this case, temperature is often logged in hourly increments by various weather reporting stations such as the CDEC and Mesowest. These data can the summed (integrated) for periods above and below freezing [#hours X temperature for <=32F and >32F] and then the ratio [ratio of degree-hours below freezing to that above freezing = FDH/HDH] or the net freezing [FDH-HDH] provides a quantitative way to compare observations with ice formation. The Index Ratio should be >1 or thawing is likely, degrading the ice and making the ice structure unsafe. Ratios of >5 indicated skatable or thick ice this season. The Net Freezing Degree Hours were 1400-2000 for 7 days for observed skatable lakes. Below is an example of processing a weeks worth of data from near Bridgeport, California. Data was copied into a spreadsheet and the values computed:   This resulted in 3-4" of ice on Bridgeport Reservoir. Observation of the temperature plot shows the long duration of cold temperatures with only short spikes above 32°F. A week of single digit lows around early December (after water has chilled during November) is an indication ice is potentially thick enough to skate on.  The following chart is an estimation gleaned from one the websites below and is a representation of ice formation trends. It shows an inital rapid phase and then a slowing of thickening. The graph is somewhat idealized since actual temperatures and diurnal/nocturnal heat flux could add significant variabilty from mean daily temperatures. Nevertheless, five days of net freezing shows sheet ice thick enough to skate. This is consistent with several years of observations in the Sierras.  An example of Index where the ratio was <1 is for Silver Lake near Kit Carson Pass. The ratio 0.48 and there was a negative Net Freezing Degree Hours. Observations on the evening of 12/8 indicated that ice was marginal <2" and melted at the edges. The water had been chilled by early snowfall but was being warmed by warm air subsidence inversions on the west slopes of Sierras during preceeding days limiting nocturnal cooling. 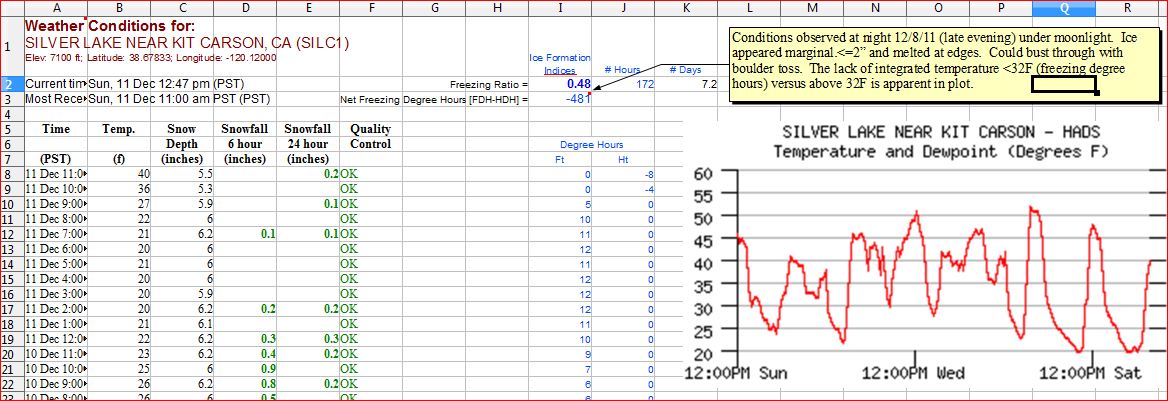 Prosser Reservoir Near Truckee  The following temperature plot from CDEC data (Martis Creek Res.) is near Prosser Reservoir and shows the temperature dipping in early December 2011. The lake was skatable by 12/10 with marginal thicknesses (reported). There werew 5 nights of teens and single digits. Another 10 days resulted in thicknesses of 6-8" around the solstice. During that time there was light snowfall on one occasion with minor effect on the ice quality. The following temperature plot from CDEC data (Martis Creek Res.) is near Prosser Reservoir and shows the temperature dipping in early December 2011. The lake was skatable by 12/10 with marginal thicknesses (reported). There werew 5 nights of teens and single digits. Another 10 days resulted in thicknesses of 6-8" around the solstice. During that time there was light snowfall on one occasion with minor effect on the ice quality.  When there is any question of thickness, the ice should be measured in several representative locations. Ideally, ice thickness can be measure with an auger or spike. It should at least estimated for a given location. Cracks or bubbles in clear ice can give and indication of thickness by simple visual parallax. Nevertheless, water does not freeze if the temperature is not cold enough. So this approach is a way to 'quantify the cold'. The data becomes a tool in predicting when good ice skating conditions can be had. There are many other variables which influence ice formation on a water body/feature, such as, size, depth, flows/currents, springs, topography and weather are important for specific locations. All of this should be taken into account. Air temperature is one of the most useful parameters readily available as an indication of the likelihood of ice formation. Additional data such as solar radiation, wind and snow-pack are also useful indicators for understanding the melt freeze cycle and probable characteristics of any ice present, particularly the presence of water ice or snow ice. Occasionally, when ice freezes before snow falls, the ice can still be skatable. If the conditions remain cold and the snow does not bond with the ice, up to 2 inches can still allow for adequate glide over the ice. Since the ice is obscured, it is even more imperative the thickness should be verified. Often early fall snow falls can form snow ice which will result in a lot of air bubbles in the ice which can make the ice weaker requiring extra thickness to account for that weakness. The most significant quality issue with snow ice is that is often creates a rougher surface even if the surface remelts. Ironically, early fall snows followed by a slight warming trend to melt any snow ice will chill the water and make it more conducive to freezing during a cold snap in late fall. Sources of Temperature Data for Estimating Ice Formation Other locations for California can be found here: http://cdec.water.ca.gov/cgi-progs/mapper These data go back some time so that that trends over the entire fall can be looked at. Another good source of surface data to see temperature trends is the Mesowest site which provides data and plots of temperature for the past 7 days for various regions: Temperatures provided by surface stations are representative and can actually vary significantly from microscale conditions at the water body(s) of interest. Overall trends with regional weather stations should be considered along with observations. It is obviously easiest to watch the ice form and make physical measurements of thickness along with observing temperatures; however, this is often not practical. With remote sensing data available on the internet, the likelyhood of ice formation can deterimined adequately enough to pursue further investigation.Early December 2011 Temperature Forecasts   Links: |
No comments:
Post a Comment