Showing posts with label Sierra Nevada. Show all posts

Tuesday, December 27, 2011

December 2011-Exceptional Season of Ice Skating in the Sierras

The month of December resulted in no significant precipitation to cover the ice that had been formed. Conditions remained cold with polar air streaming around the stationary ridge that was blocking the storm systems. The high pressure was promoting subsidence inversions that was capping the cold air in the valleys. Some low lying areas were much colder than higher elevations. Temperatures dropped into the single digits and even subzero temperatures the week before the winter solstice. Without any snow, ice skating became prevalent in the Lake Tahoe area and all along the Eastern Sierras. With it this good, it even made the main stream news.

Bridgeport Reservoir December 10th

Virginia Lake December 10th (old but clean sections-good for the Alpenglow)

Tioga Lake December 11th (next 4 pics) - old thick but glassy between crack lines


Prosser Reservoir
Temperatures in the basin around Truckee were getting into the single digits and this provided solid 6-8" ice on Prosser Reservoir. Most of the lake was frozen with the west arm having the most consistent smooth ice and easy access. Several other lakes and ponds in the Tahoe area had excellent ice skating conditions.


More Pictures December 23rd:
https://picasaweb.google.com/111461517128275850244/20111223IceSkateProsserReservoir?authuser=0&feat=directlink


Conditions at Tenaya Lake
This a beautiful lake in Yosemite accessible by Highway 120.  This is quintessential treat for anyone that loves skating on natural ice.  Tenaya was marginal in early December, but consistent drops into the teens thickened the ice.  This inspired skaters from all over to come enjoy it.


..Gotta do another road trip
Some videos on YouTube inspired me to head back up, since being able to drive to Tenaya and have good ice this time of year are both rare.   It looked like the night/morning of 12/27-28 was going to be the last of the cold period AND it was holiday season.  Gotta try.....
We got to Tenaya and skated at sunrise (of course the ~East/West orientation keeps the lake in shade for quite a while this time of year-which is good).   The ice was a foot thick with the thinnest spots in isolated areas around 4-5" thick and only a few melt spots near the outlet and a spot in the middle that was sheeted but thin.  The ~north side of the lake had the ice buckled up onto the shore form expansion; the expansion actually having moved boulders.  The south side which appeared to remain in the shade, was clear black ice.  Although cracked, there were stretches of very glassy smooth ice that provided incredible glides with a view of the lake bottom.  Being able to see through ice while skating is a treat.  It feels as though I'm simultaneously observing a transcendence of dimensions and physical phases while in motion. 
We arrived and skated in solitude for a couple hours.  Soon skates and travellers showed up.  By the time we left around 1:30pm, there were well over a hundred people enjoying the ice.  Temperatures in warm spots were close to 60°F and people began sunbathing.  The ice surface began to form a skim layer that was getting close to the high spots by the time we left.  The south side in the shade remained good quality with no apparent melt.  If no snow falls over the next couple weeks, the melted skim layer could form a natural Zamboni effect.  With the slab of ice that is already there, clear nights with lows in the low 20s or teens should keep the ice in good shape, with the skim layer even improving the surface. 

Temperature trend shows warming on the afternoon of the 28th which formed skim layer:

Tenaya Lake Morning of December 28th


It was so good I went back twice......

Worth the Choreography.....

It is mid-January and still no snow.  Temps have been cold enough that morning skates are probably still good although ice is getting old and blemished with surface aberations even with some skim layers forming.

Link to more pictures: https://picasaweb.google.com/111461517128275850244/20111228TenayaLakeIceSkate?authuser=0&feat=directlink


Below is a link to a video someone posted online in mid-December.  Made me want to head back up for one more skate.


Synoptic Weather Pattern in Early December Setting up a persistent pattern


Recent strong NE winds may have blown the small amount of snow off any previous ice if the snow did not fall wet or cause snow ice. The following plot is from the CDEC Water resources site: http://cdec.water.ca.gov/cgi-progs/queryF?TNY


Sources of Temperature Data for Estimating Ice Formation

Other locations for California can be found here: http://cdec.water.ca.gov/cgi-progs/mapper
These data go back some time so that that trends over the entire fall can be looked at.
Another good source of surface data to see temperature trends is the Mesowest site which provides data and plots of temperature for the past 7 days for various regions:
Temperatures provided by surface stations are representative and can actually vary significantly from microscale conditions at the water body(s) of interest. Overall trends with regional weather stations should be considered along with observations. It is obviously easiest to watch the ice form and make physical measurements of thickness along with observing temperatures; however, this is often not practical. With remote sensing data available on the internet, the likelihood of ice formation can determined adequately enough to pursue further investigation.

Early December 2011 Temperature Forecasts

Forecast for the week is single digits and teens for lows in the Eastern Sierra cold air basins. Some inversions indicated at upper levels moderating temperatures, but generally colder higher up. Daytime highs in the 30s and 40s. A week worth of single digit lows and only 8 hours of daylight for ramping

Monday, December 26, 2011

Ice Skating on Natural Ice in California


With changes in temperature and weather patterns bring changes in recreational opportunities. Every late fall on the approaching winter solstice there is the potential for good natural ice for ice skating.  The winter solstice with low sun angles and long nights often brings cold temperatures to high elevations. This can be augmented with favorable weather conditions. When snow does not prevail for snow sports, ice can be great if a persistent polar jet sets up with only early fall snows to chill down the water.


Skating Bridgeport Lake


Ice Safety
 Testing the ice is curucial for safety.  A drill is usful for verifying thickness.  In good water ice, cracks can give an estimate of thickness from the thickness of the shearplane.  Also, small bubbles can indicate depth.  Over 3" of good water ice is adequate for supporting a skater; 5-6" provides good margins.  A portable electric drill with a 1/2-3/4" diam. 6" long bit works well for determining thickness (keep battery from cold soaking prior to use). 
The Kiwis have been making good use of ice on the South Island of New Zealand have an excellent site with good eneral information (I'm going to have to go skate there sometime; the east side is much like the Eastern Sierra).  http://iceblock.org.nz/safety/
Here are additional sites with useful information on ice formation and safety:
http://www.blueiceonline.com/howsite/lakeice_about.html
http://lakeice.squarespace.com/thickness/
http://www2.gi.alaska.edu/alison/ALISON_SCIENCE_BConcepts.html


It is important to recognize ice variabiilty inherent with water bodies.based upon subsuface flow, artesians, springs, inlets/outlets. Surveying ice from aircraft can help identifying good ice areas.


Weather and Ice
 The weather is of course crucial for not just forming thick enough ice but also the quality.  Late November 2011 has provided a string of dry cold days due to a stationary high pressure and a low to the south with the polar jet providing the chilldown.  The condition is somewhat characteristic of a Rex Block which is the reverse "S" pattern of the high pressure which prevents eastward migration of the high pressure from the the complimentary cyclonic and anti-cyclonic flow around the low and high.  A key is a persistent high pressure over the west coast blocking storm systems with the anti-cyclonic cold northerly flow around the high providing the low temperatures needed.  These persistent cold dry condition can be favorable for good ice formation.  Monitoring the weather conditions can help identify periods favorable to ice formation.
Weather is particularily important in the Sierras for determining good safe ice due to the relatively mild conditions that can prevail in fall.  It is the trends and duration of cold that provide good sheeting.  Although ice can thicken into January and February at higher elevations where freezing condiotns are more persistent, the best quality ice often occurs early season before much snow has fallen and ruined surface conditions.  The short days of late fall provide the advantage of duration or cold nights and low sun angles to provide net freezing. 
The following graph illustrates typical trends ice sheet formation thickness versus time for various temperatures:


December 2011-Exceptional Season of Ice Skating in the Sierras
The month of December resulted in no significant precipitation to cover the ice that had been formed.  Conditions remained cold with polar air streaming around the stationary ridge that was blocking the storm systems.   The high pressure was promoting subsidence inversions that was capping the cold air in the valleys.  Some low lying areas were much colder than higher elevations.  Temperatures dropped into the single digits and even subzero temperatures the week before the winter solstice.   Without any snow, ice skating became prevalent in the Lake Tahoe area and all along the Eastern Sierras.  With it this good, it even made the main stream news.

Bridgeport Reservoir

 Virginia Lake

 Tioga Lake


Ice Skating on Natural Ice in California: Development of an Index for Remotely Estimating Probable Ice Formation

Availability of real-time weather data has revolutionized the ability to monitor remote locations for conditions suitable for ice formation. Since ice formation requires sustained cold temperatures one can surmise that if one were to quantify the amount of freezing versus thawing, one could come up with a reasonable estimate of forecasting ice. There are other variables that go into good quality skating ice, but paramount is temperature trends.  This is particurily helpful if one does not reside near the water bodies in question.

The short days and long nights in late fall provide a skewing of cooling/freezing hours. When temperatures fall below freezing at sunset and stay freezing after sunrise for several days during late fall-winter solstice times, ice formation becomes more favorable. Since temperature can spike during the day, temperatures typically need to fall well below freezing to insure adequate cooling to overcome heat flux form absorbed solar heat and latent heat exchange.  Otherwise, thawing occurs.  Optimum conditions often occur on new water ice that sheets clean rapidly in very cold calm conditions. Rapid cooling can produce ice with fewer air bubbles making the ice clear and transparent. Once ice has formed, latent heat of fusion works to the advantage of maintaining state through short warming periods allowing water ice to form in subsequent cold snaps; however, it is the new ice that is often the best and also the thinnest.  Ice for ice skating is often good early season before snow has had a chance to cover the ice and ruin the ice. Ice that has under gone excessive freeze-thaw, strong winds or accumulated debris can ruin the quality also.    Old ice tends to crack and form ridges which ruins quality. Early season/late fall ice is often best; often this ice is on the thin side which requires careful monitoring of conditions during formation.


Ice Formation Index

For lack of a better term, I am using this term to describe the integrated temperature conditions over time that favor ice formation for ice skating. The index utilizes the a concept of integrated temperature accumulation above or below a reference value to indicate an accumulative effect.   Although one could use an average, that can be misleading, since spiked low minimum temperatures can skew the average. In this case, temperature is often logged in hourly increments by various weather reporting stations such as the CDEC and Mesowest. These data can the summed (integrated) for periods above and below freezing [#hours X temperature for <=32F and >32F] and then the ratio [ratio of degree-hours below freezing to that above freezing = FDH/HDH]  or the net freezing [FDH-HDH] provides a quantitative way to compare observations with ice formation.  The Index Ratio should be >1 or thawing is likely, degrading the ice and making the ice structure unsafe.  
Ratios of  >5 indicated skatable or thick ice this season.  The Net Freezing Degree Hours were 1400-2000 for 7 days for observed skatable lakes.  Below is an example of processing a weeks worth of data from near Bridgeport, California.  Data was copied into a spreadsheet and the values computed:


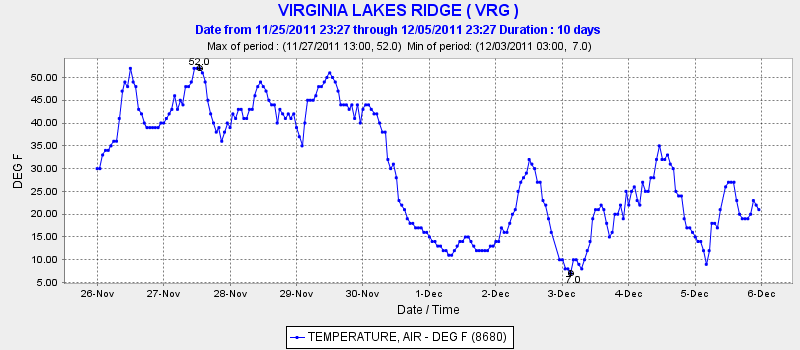
This resulted in 3-4" of ice on Bridgeport Reservoir.  Observation of the temperature plot shows the long duration of cold temperatures with only short spikes above 32°F.  A week of single digit lows around early December (after water has chilled during November) is an indication ice is potentially thick enough to skate on.


The following chart is an estimation gleaned from one the websites below and is a representation of ice formation trends.  It shows an inital rapid phase and then a slowing of thickening. The graph is somewhat idealized since actual temperatures and diurnal/nocturnal heat flux could add significant variabilty from mean daily temperatures.    Nevertheless, five days of net freezing shows sheet ice thick enough to skate.   This is consistent with several years of observations in the Sierras. 


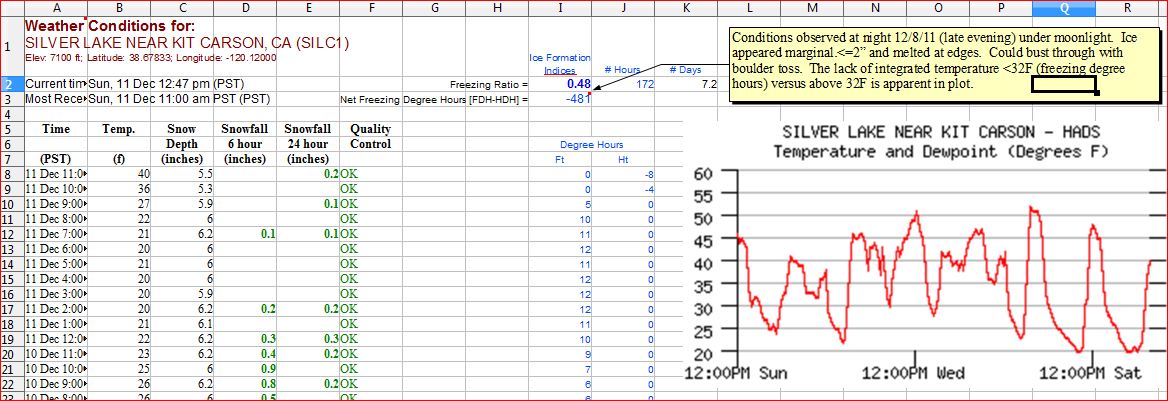
An example of Index where the ratio was <1 is for Silver Lake near Kit Carson Pass.  The ratio 0.48 and there was a negative Net Freezing Degree Hours.   Observations on the evening of 12/8 indicated that ice was marginal <2" and melted at the edges.   The water had been chilled by early snowfall but was being warmed by warm air subsidence inversions on the west slopes of Sierras during preceeding days limiting nocturnal cooling.


Prosser Reservoir Near Truckee
The following temperature plot from CDEC data (Martis Creek Res.) is near Prosser Reservoir and shows the temperature dipping in early December 2011.  The lake was skatable by 12/10 with marginal thicknesses (reported).   There werew 5 nights of teens and single digits. Another 10 days resulted in thicknesses of 6-8" around the solstice.  During that time there was light snowfall on one occasion with minor effect on the ice quality. 


When there is any question of thickness, the ice should be measured in several representative locations. Ideally, ice thickness can be measure with an auger or spike. It should at least estimated for a given location. Cracks or bubbles in clear ice can give and indication of thickness by simple visual parallax. Nevertheless, water does not freeze if the temperature is not cold enough. So this approach is a way to 'quantify the cold'. The data becomes a tool in predicting when good ice skating conditions can be had. There are many other variables which influence ice formation on a water body/feature, such as, size, depth, flows/currents, springs, topography and weather are important for specific locations. All of this should be taken into account. Air temperature is one of the most useful parameters readily available as an indication of the likelihood of ice formation. Additional data such as solar radiation, wind and snow-pack are also useful indicators for understanding the melt freeze cycle and probable characteristics of any ice present, particularly the presence of water ice or snow ice.

Occasionally, when ice freezes before snow falls, the ice can still be skatable. If the conditions remain cold and the snow does not bond with the ice, up to 2 inches can still allow for adequate glide over the ice. Since the ice is obscured, it is even more imperative the thickness should be verified.
Often early fall snow falls can form snow ice which will result in a lot of air bubbles in the ice which can make the ice weaker requiring extra thickness to account for that weakness. The most significant quality issue with snow ice is that is often creates a rougher surface even if the surface remelts. Ironically, early fall snows followed by a slight warming trend to melt any snow ice will chill the water and make it more conducive to freezing during a cold snap in late fall.


Sources of Temperature Data for Estimating Ice Formation

Other locations for California can be found here: http://cdec.water.ca.gov/cgi-progs/mapper
These data go back some time so that that trends over the entire fall can be looked at.
Another good source of surface data to see temperature trends is the Mesowest site which provides data and plots of temperature for the past 7 days for various regions:
Temperatures provided by surface stations are representative and can actually vary significantly from microscale conditions at the water body(s) of interest. Overall trends with regional weather stations should be considered along with observations. It is obviously easiest to watch the ice form and make physical measurements of thickness along with observing temperatures; however, this is often not practical. With remote sensing data available on the internet, the likelyhood of ice formation can deterimined adequately enough to pursue further investigation.
Early December 2011 Temperature Forecasts

Forecast for the week is single digits and teens for lows in the Eastern Sierra cold air basins. Some inversions indicated at upper levels moderating temperatures, but generally colder higher up. Daytime highs in the 30s and 40s. A week worth of single digit lows and only 8 hours of daylight for ramping with maxes in the 40s usually means a net gain in thickness. The slight warming in the day can help glaze the ice, a natural zamboni effect.


Links:


Saturday, October 8, 2011

Theta and Theta e for Estimating Areas of Maximum Thermal Lift

Equivalent Potential Temperature (Theta e) and its abbreviated counterpart, potential temperature (theta), are important parameters that determines relative buoyancy of airmasses. Identifying where maximum surface theta e is often correlates with areas of strongest convective lift. If there is good capping aloft but good lapse rates and dewpoints are not too high these parameters that helps identify where zones of good thermal lift can be found. Here is a good description of Theta e and theta from meteorologist Jeff Habby

and more on Potential temperature:

Theta is temperature simply adjusting for pressure altitude, discounting the adjustment for water vapor. From a practical standpoint, theta can be used in place of theta e for estimating thermal heights for general soaring conditions atmospheres that are capped and not inclined to overdevelopment. Until LcL or CcL is reached and the latent heat is released, the influence of atmospheric moisture on density/buoyancy is small. Estimates of surface theta can be easily made from surface reporting stations where the elevation is known.  Here are two useful sites for obtaining these data:
http://forecast.weather.gov/MapClick.php?lat=36.88181755936464&lon=-121.40853881835937&site=mtr&unit=0&lg=en&FcstType=text

http://www.wrh.noaa.gov/mesowest/frame.php?map=mtr&limit=1
-
With the paradigm shift occurring with interactive forecast tools on the Internet, it is possible to get broad based estimates of where maximum surface theta is both forecast and reported along with forecast or current surface dewpoints.  These data can then be used in conjunction with forecast soundings from NOAA FSL to determine thermal heights and cloudbase.  Here is a link to the site with a sample location near Hollistere, CA: http://rucsoundings.noaa.gov/plot_soundings.cgi?data_source=Op40;latest=latest;n_hrs=8;airport=36.881818,-121.401672;plot=Java-based%20plots&start=latest

The interactive soundings allow for determination of boundary layer (BL) tops quickly with simple inputs of the temperature and dewpoint.  The value of using estimates of potential temperature is that by adjusting for elevation/altitude, the  BL tops can rapidly by assessed simply by observing where the sounding at a particular location intersects the isentrope lines (lines of equal theta) on the SkewT.  In addition, once the theta is estimated, one does not need to click on the specific height and .

.temperature to obtain the BL mixing profile, but anywhere on the estimated potential temperature line.

Finding a sounding location:
Kurt Thames created an interactive Googl;e Map that links ot the FSL Forecast sounding for a selected location by clicking the the location.  This map allows close correllation with the NWS interactive Google Maps for both forecast and current temperature. http://thams.com/flying/skewTmap.html

Sources of Theta on FSL Soundings and how to use: < to be created>

Friday, July 15, 2011

Avenal to Bishop Passing Mt. Whitney

This was my second successful attempt at getting to the High Sierra from the Central Coast Ranges and passing Mt Whitney in a glider. Two ambitious pilots, Morgan Hall and I, in his Duo Discus, 5H, making the best of average good conditions for achieving a 'Round the Horn' flight. Although the goal was the PASCO Egg at Air Sailing north of Reno, NV, we achieved most the critical elements of the flight. With a couple more hours, Air Sailing would have been reachable; i.e., a slightly better/earlier conditions at start. Morgan elaborates on teh flight in prose and pics here: http://landseaandsky.blogspot.com/

Friday, May 22, 2009

May 17, 2009 Hollister to Mount Whitney

This flight is one that I needed to write about but it took all week to get around to it. It has taken a few days to sink in enough. I have been in a little bit of a daze. I had to do the video first as a creative outlet ;-) It was a long sought after goal: To fly from Hollister to the highest point in the conterminous US. This was something that hadn’t been done before from a Bay Area soaring site. The goal was symbolic on many levels. Besides the being the highest peak, it required a departure from the Central Coast Ranges into the Sierra-Great Basin soaring region which required getting around or across the Great Central Valley which is often a distinct airmass that acts as a sink hole. A couple attempts had been made, although most flights from Hollister were geared toward gaining miles over the lower desert, since that direction made better straight line distance from Hollister. I made an attempt on April 21 by crossing the valley from 14.5K near Taft which gave me helpful insight and motivation to attempt the task again. The conditions in April were a similar event, at least on the Central Coast as on May 17. Trends and patterns had been showing a repetitive pattern such that we were likely to have more opportunities to attempt the flight. I was watching the long term forecasts closely. From early May I began to see a pattern shift building toward another ‘event’ and this began garnering my attention and taking much of my focus.
Over the past several years I have been watching the weather patterns that give exceptional soaring conditions. The BLIPMAPS, XC Skies, etc. are indispensible tools, but they are really the vernier with regards to the whole forecast picture of when good soaring conditions are likely. Having an idea of larger scale patterns that provide good conditions for specific tasks allows for better long term planning and scheduling and provides insight and perspective as to why certain conditions are manifest in the BLIPMAPS and Forecast soundings. Through observation, trial and error and ever improving meteorological forecasting tools, estimating when conditions are going to be favorable several days out is getting better all the time. Ten days out is still rolling the dice as far as high confidence in prediction. But, when one is looking at synoptic patterns that have demonstrated consistently good conditions, it is the consistency between models showing evolution of a favorable pattern trend that gives confidence. As with all long term forecasting, models can sometimes change their mind at the drop of a data point. The important thing is monitoring for trends in the evolution of the pattern one is looking for. Synoptic patterns have a larger temporal as well as spatial scale so it is a good place to start. When models converge on favorable synoptic behavior, confidence increases.
One particular WX pattern that has consistently brought good conditions has been specific heating events that occur on the Central Coast. Some of the best thermal height gains on the Central Coast have been made during these events. After getting to 14K over the coast range several years ago, I began taking notice of common characteristics associated with those conditions, since they would repeat periodically in spring and occasionally summer and early fall. This pattern has certain characteristics that can be seen in the synoptic scale/large scale models when it begins to set up. It is relatively easy compared to some other conditions to see coming a long ways off. It is a little different each time, often adding a little twist, but there are certain synoptic scale characteristics that have always been present which allows for identification of these conditions in the long term forecast.
The optimum ‘window’ for soaring these heating events becomes subject to, not just the larger scale pattern, but the smaller scale met events that effect the dynamics of heating and marine influence. Sometimes the heating events can never get going much or can be squelched by premature marine intrusion. What is required is persistent set up of a high pressure ridge slightly to the north, often tilted that initially creates strong subsidence warming in a general offshore flow over the Bay Area and Central Coast in initial stages . When this high is associated with a low to the ~south, this promotes a complimentary southeast flow aloft (sometimes forming a 'quasi Rex Block' condition initially) and also aids in mixing out the subsidence caps that were initially setup by the NE flow from the high. [At one end of the elephant] This low seems to slow the West to East advancement of the ridge which helps with persistent warming closer to the coast, allowing for favorable lapse rates and deeper mixing. The first days of warming on these heating events are often associated with a subsidence cap that is slow to break. The initial ramping period sets up an ‘adiabatic flow path’, visible in the forecast soundings, that eventually mixes out the cap and brings the favorable lapse rate profile closer to the surface. At peak, trigger surface temperatures are typically reached sooner than preceding ramp up days. Once the subsidence cap is minimized or even obliterated, the system is primed and is at the peak. Even at peak, time for breaking the lower level cap at hot spots can be later than ideal for long distance. Peak, and sometimes ramping, conditions are often good for flying west toward the Santa Lucias. A convergence line, with heights >12K can form over the Santa Lucias. Sometimes can extend down the mountains east of San Luis Obispo before wrapping more east; i.e., last Saturday and in mid-April. Capitulation of the heating trend is often associated with strong influx of marine air. When timing is right, very strong convergence lines can form running ~south. For these ‘mega height heating days’, early on my goals were focused on flights that allowed creative tasks that deviated from the standard ELevator routes, like going over to the Santa Lucia Coastal Range. Then, I began to look at conditions in regions beyond and how it correlated with this phenomena for XC flights and see what others were doing. It became apparent that the southern half of the pattern would sometimes promote favorable conditions from Cuyama Valley to Tehachapi , but sometimes the Sierras would be unfavorable when it was good on the CC ranges. Observation showed that excessive SE flow, interior subsidence or strong influx of subtropical moisture made conditions toward the Sierras less favorable. The broader the task range, the more adjacent met conditions needed to complement each other. Ideally, to achieve my goal of making it to Whitney, it required favorable conditions for the entire route, once again the "Goldi-Locks Syndrome". Since my attempt of getting to Mt. Whitney on April 21st, I was re-evaluating my strategies. On that attempt, I crossed the valley and got up on the other side too late to continue. Although a valley crossing is possible, ‘running around the horn’ was looking to be more reliable in terms of contiguous lift to maintain adequate XC speed. Because of the cyclic pattern we were seeing, I had good confidence that another event would occur within 2-3 weeks. Subsequent to 4/21 we had a persistent zonal flow that was providing average conditions out of Hollister (great wave in the Sierra). Looking at hemispheric circulation, the zonal flow was bound to buckle. First hints showed a dramatic shift with a polar jet diving down which was different but good in itself. That went poof and then I began seeing steady progressive signs of the pattern I was looking for set up. I was seeing consistency by the 8 day, then it began appearing in the FD. The 3 day window was looking good for 5/16-5/18. The pattern was following the usual trend, but there were some changes as the weekend approached, the high in the north was beginning to get obliterated by a Gulf of AK low by Monday with the dominance of the low to the south potentially bringing some subtropical moisture in to the area particularly the southern Sierra. Temperatures were supposed to drop 5-10°F on the Central coast but with complimentary drops aloft. This was coupled with the fact that the offshore pressure gradients were light which would beckon earlier marine influence. Breakdown of the high to the north was telling on the acceleration of the event. Sunday May 17 was stacking up to be the best day for both running south and getting onto the Sierra. Not only that, as more of the models and maps came online, it was apparent that peak heating would be coupled with onset of onshore gradients as a kicker. Over the past few years I have seen a general increase in persistence of the event (period length) with a gradual gain to max; greater persistence, often better the event. This has provided good conditions at peak, but the ‘classic’ convergence would often follow the next day after peak heating closer to Hollister. This event had been compressed in time but with good magnitude (ramping). Moreover, for the task of making Whitney, the conditions were looking favorable for going ‘around the horn’. The light SE flow was going to promote the convergence between the grapevine and Tehachapi (a critical link) and provide favorable conditions up the Sierra with a tailwind.As forecasts approached the 5 day, dialing in on the peak period got more refined. From several days out, I could see Saturday would still be ramping. It was likely to be Sunday or Monday. As Ramy had said, Saturday was a warm-up day [and look what Hollister pilots do on a warmup day starting at close to 2pm; what a team]. On Saturday forecasts, NE flow aloft and subsidence could be seen on the sounding. It was going to require temperatures of 100°F to break a significant inversion cap starting from relatively cool morning temps. This was not likely to occur until closer to peak heating rather than solar noon and this proved to be the case. By the time the day got closer, I became progressively more confident that Sunday would provide a good shot at the goal. I was planning on going up with a fellow BASA member, Larry, since he was interested in experiencing some “good XC soaring out of Hollister”. I asked him if he had any time constraints and he said "no". He apparently didn’t understand what I meant. When I began to talk about the possibility of returning Monday by various strategies, he politely informed me that, as doctor, he had 6 surgeries lined up on Monday. I recognized that returning across to the Diablo’s was not probable early enough and a Central Valley landing was likely. An aero retrieve would be possible if we could get close enough to Hollister and sync out our landing with the towplane. Although I was very confident in being able to achieve the task, I was still more confident that the sun would set on Sunday, regardless of what I did ;-) So, to insure that I got the doctor back on schedule I lined up 2 options for having him flown back to Hollister after we landed. How confident was I? This was clearly going to test me. I needed to nail this. Another little glitch was in the 5KM flight instruments. The Cambridge Flight Computer had started acting up and was giving erroneous data, especially winds. The FC issue was easily resolved with my PDA, however, the audio on the vario was out and the two varios were out of sync. The audio sound when going up, psychologically, must be like a security blanket to soaring pilots. So, on Saturday I decided to test my hang gliding vario to see if it worked in the cockpit, albeit uncompensated. It did, the beepy thing went off loudly when I was going up, and so it became an added gadget. As long as the altimeter was working, I would know when my ‘bucket was actually filling’. This actually proved to work rather well in conjunction with other instruments. The HG vario is very sensitive and repsonsive, so I was able to calibrate my brain to stick induced thermals. Practically, for this flight it was as much about altitude, position and time, rather, keeping the glider pointed on course. As it turned out, it was helpful in decision making. Once on course, for the most part, I simply didn't waste time with thermals that weren't clearly productive, as in altimeter response. I was obsessively going over strategy; where were the gaps and problem spots that could hang me up, where would I need to make good time. I needed strategy that provided adequate speed without compromising success of the mission; like ‘tweeking the mixture then backing it off a bit’. After Saturday, my confidence went up. It was rapidly going from "I can" to "I will" do this. The day looked so good for the task on most of the course, that I shifted my focus to launch time. I needed to be off by noon to make this work. Forecast soundings showed that it would require potential temps of 100°F + to get things ripping and it wasn’t going to be very strong until then. Saturday’s late conditions gave some indication. The advantage on Sunday was that temps had already ramped and the higher temps would occur sooner than Saturday. I looked at multiple locations to get a reasonable picture and they all pointed to closer to 1pm for it to crank except for potential hot spots. Where were the hot spots? By integrating the RASP heights and flow vectors and correlating with NWS and other estimates of surface temps, it was pointing to just to the west of Chamise being the closest location en route to aim for. For timing, it would require some microassessment and a bit of a hunch. With calm conditions, by noon, there would likely be pockets of heating that had potential temps down south of Hollister >105°F. There was a lot of heat flux, we just needed an early 'dragon bellowing '. The FlightNoon appeared to be about right. If for no other reason than I was getting baked off the ramp, it was physiologically necessary to get up where it was cooler. We launched shortly after noon toward Chemise releasing about 4.5 nm NW of the peak. Worked up to 8K and then SW of the Chemise got over 11K. Cus were starting to pop to the south. Heading southeast, there was nothing much at EL2 which is interesting since the line from my first lift to the clouds was well West of EL2. SW of Hernandez near Pond on the west side I worked along above ~7K until I got to the clouds where VN was climbing like a rocket . From there I climbed to 14K when clouds started to pop to the south toward Paso Robles. This is where I put it into overdrive. My confidence was getting better as I could see nice cus over the Sierras and faintly down by the Grapevine. A nice line of clouds could be seen over the Machecsna Mtn. area south of Paso heading to New Cuyama. Heading south toward Paso, VN was holding his pace ahead and TG passed me en route making good use of his ballast. The line was clearly west, but I could see from the westerlies on the ponds below around Paso that the marine convergence was ‘feeding the machine’; the kicker was also the electric blue Coolaid on a hot sidewalk scenario for any attempt at return. In prudence, I stayed pumped up until near Camatta. After that it was mostly porpoising around 11K. At the Calientes I pumped up above 14K and waved New Cuyama goodbye several minutes before my target time of 3pm. Bases were getting mostly higher to the east as forecast. Area around Mt Pinos had the characteristic multi-cu base mix of a multi-airmass convergence: ~13K to the north with bases to the SW at ~15K+ and the bases to the S and SE were over 16K. TG had run to the south side and was encountering good lift. I had considered this to be possible a hardspot so, conservatively, I made use of the conditions by getting over 17K under the highest bases near the Grapevine. U2 was wasting no time and blew by me (reminded me of the Hot Rod Lincoln song). I could see cus running up the Sierras, lower to the west, but high markers to the east. BTW, the western line had been well forecast but was supposed to fall apart and better air shift east later afternoon which was exactly what was happening (Note¤ below on 33]. We were South of Tehachapi at 4PM target time, I pumped up again above 16K. Needless to say, my confidence was high about making Whitney at that point. In fact, it had been a cake walk ever since topping out near Priest Valley. The SE flow was helping set up a nice convergence up the Southern Sierras. The tailwind helped things along. Cu bases to the west were lower and some clouds to the NW were OD’ing. Near Isabella I shifted to the East side of the Kern Plateau. I pumped up at Olancha Pk. and only turned for pictures after that. Meanwhile, TG was ahead and just passing Whitney. My goal was to be heading West from the crest by 6pm. I passed by Whitney at 5:41, passing by Mt. Brewer and peering into the Kings Canyon 10 minutes later on schedule. Gliding out toward the valley, estimates were that I would probably get a westerly to northwesterly flow down lower. This is where a functioning Cambridge flight computer would have been helpful for more precise winds. I had Madera within glide and headed WNW. Although still above glide, it became apparent as my glide diminished steadily from the light headwind that Making Madera was questionable and it could put me in FAT Class C airspace if I had to abort. Also, FAT was the best alternate. So, I proceeded to fall back on previous alternates. I had good glide to several airports south of Fresno. Reedley had been dialed in and it had one of the longer runways at 3300 feet. Distance gains closer to Hollister at this point were mostly academic; although if I had been thinking OLC points or max km only, I would have been strategizing differently from the crest. Interestingly, Reedley was apparently the home to CCSC for awhile, so, it was a good order to commemorate them. Winds were close to calm on the surface, so we landed Rwy 15 to roll up next to the ramp. It was too late for an aerotow that evening since I could not get a radio relay to Hollister. So, I contacted Mike Nelson to fly over and pick up Larry to ferry him back. We got back in good time for him to get some sleep. All in good time. Mike and I got the glider the next day. Nailed it.
Reflecting and The FutureAlthough these were exceptional conditions, I believe it is possible to do flights around the horn to the Sierras more often than we think. In post evaluation, this flight was easy in that, although somewhat daunting, I had a very high confidence on achieving it, partly because of reliable forecasts of contiguous lift, but also because the course legs have all been proven doable. Through preparation, planning and creative visualization, I had created a model for the flight that worked so succinctly, the flight itself was a matter of going through the motions. What is further telling, Ramy utilized the information several of us had been discussing and converted it to League tasks, and then he smoked the course. Although this was an outer limit, a fantasy flightnot long ago, just like a few years ago when we were pondering going to the Santa Lucia's or extending our boundaries in other directions, this achievement has opened the door to more flights over to the Sierra and GB. Flights to Mt Whitney will become standard tasks from Hollister in even less epic conditions because we will learn the nuances. The door is opened. Even if one were to fly to Tehachapi and launch the next day to fly up the Sierras. That is something that is often doable. A few years ago I presented the idea of doing a soarfari 'around the horn', up the Sierras/Whites to TRK-MEV and then up to Montague and then back down to Williams. Anybody game?
pics:
http://picasaweb.google.com/MattmanG3/HollisterToMtWhitneyMay172009#

OLC Flight Tracehttp://www.onlinecontest.org/olc-2.0/gliding/flightinfo.html?flightId=1386084491
¤ A flight from another pilot, Christian Mackin (33), launching from Cal City on May 17th actually was able to run the Western Divide earlier in the day (see OLC for trace) . Not many have been successful on this route talking with pilots who have flown that area a lot. This line deteriorated later and the best lift had shifted east. He attempted to work this same line later but was not getting the altitudes. This verifies that the Western Divide does in fact work as indicated by numerous observations of the ‘Maps’. It just shifts with the westerlies which is so common in many places in the West. So, using this line would probably be more difficult to connect early enough from Hollister unless one could cross early and climb the western slopes. Theoretically, crossing north of Taft by 2pm could put one there in good time, however, for met events like we had, conditions don’t usually start early.